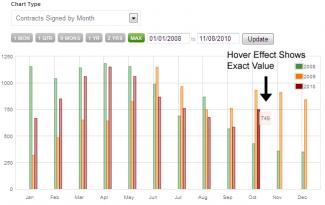
It's the nature of things, both here at Luxury Rentals Manhattan and elsewhere in the world, to see things out of context. After all, what's happening right now generally seems more important because of that right-nowness. But when it comes to Manhattan apartment rental figures -- heck, when it comes to anything at all -- context is the thing. Slight fluctuations from month to month are meaningful as far as they go -- that is, 30-odd days -- but not so meaningful beyond that. Which, besides the fact that we're kind of into anything having to do with Manhattan apartment rentals, is why we so dig UrbanDigs' multi-year, context-rich NYC real estate rental chart. So, what are we looking at, here?
The short answer would appear to be a 28% increase in monthly rental contracts signed on NYC rental apartments. But what makes the chart so useful -- and, if we're going to be dorky about it, so cool -- is the way it puts that particular eye-popping stat in context. The context being that September was one of the worst months for New York apartment rentals in recent memory, and that October 2010's rental statistics make a lot more sense when viewed in a longer, larger perspective. Actually, let's just leave this to the professionals.
"The delayed seasonality in 2009, the adjustment year following Lehman's failure, resulted in large year-over-year gains early in 2010 (compared to a dismal early 2009) and year-over-year declines for the summer of 2010," writes UrbanDigs lead blogger, um, urbandigs, "We should take that into account when interpreting [year-over-year] numbers against the year that saw major volatility from Oct 2008 to February/March 2009. For now, deals are being signed and its definitely more active out there than it was in the past few months." Not only does that make sense, it makes more sense than that simple 28% increase does out there all by itself. Context: it's what Luxury Rentals Manhattan is all about. Well, we're also about luxury rental apartments in Manhattan. But context, too.


